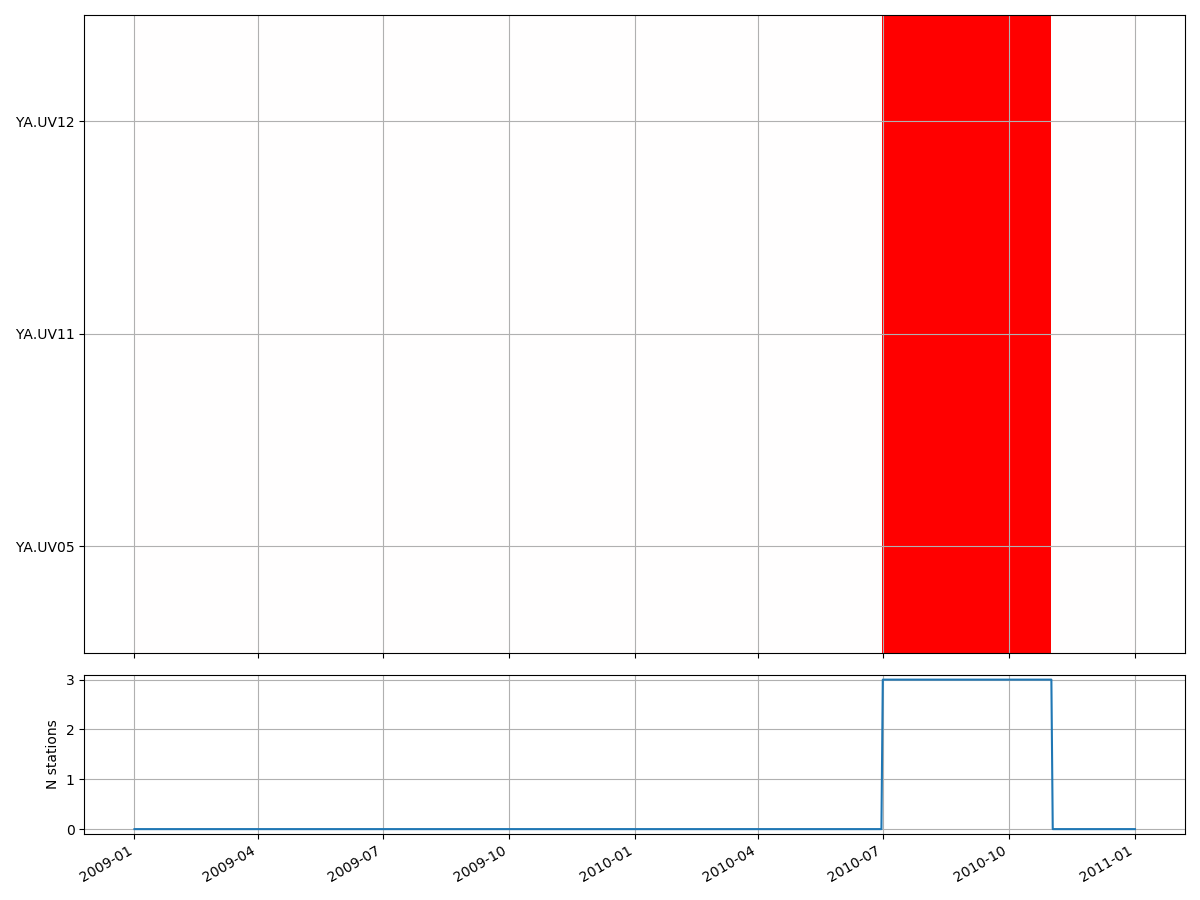
→ Plot Data Availability
Plots the data availability, as contained in the database. Every day which has a least some data will be coloured in red. Days with no data remain blank.
msnoise plot data_availability --help

Usage:  [OPTIONS]

  Plots the Data Availability vs time

Options:
  -c, --chan TEXT     Channel, you can use the ? wildcard, e.g. '?HZ'
                      (default) or 'HH?', etc.
  -s, --show BOOLEAN  Show interactively?
  -o, --outfile TEXT  Output filename (?=auto). Defaults to PNG format, but
                      can be anything matplotlib outputs, e.g. ?.pdf will save
                      to PDF with an automatic file naming.
  --help              Show this message and exit.
Example:
msnoise plot data_availability :
