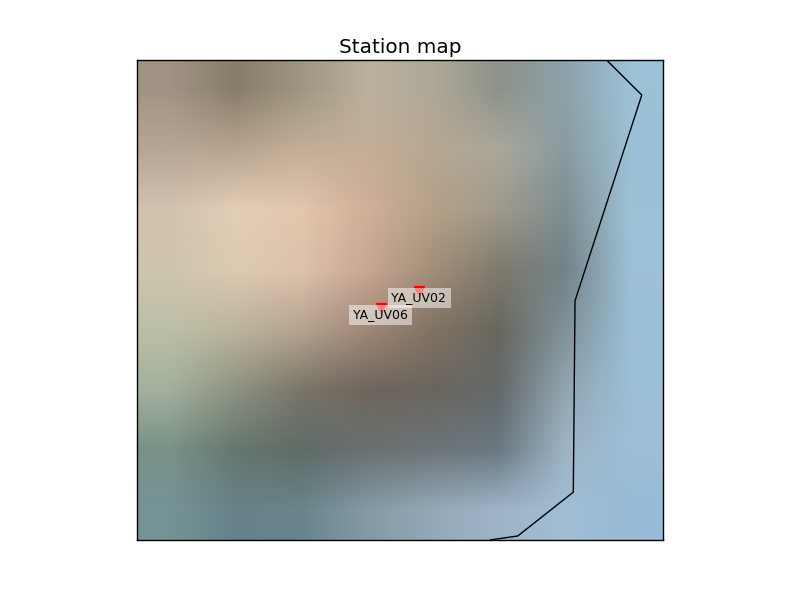
→ Plot Station Map
This plots a station map using PyGMT.
msnoise plot station_map --help

Usage:  [OPTIONS]

  Plots the station map

Options:
  -s, --show BOOLEAN  Show figure interactively?
  -o, --outfile TEXT  Output filename (?=auto). Supports any matplotlib
                      format, e.g. ?.pdf for PDF with automatic naming.
  --help              Show this message and exit.
Example:
msnoise plot station_map :
It will also generate a HTML file showing the stations on the Leaflet Mapping Service: