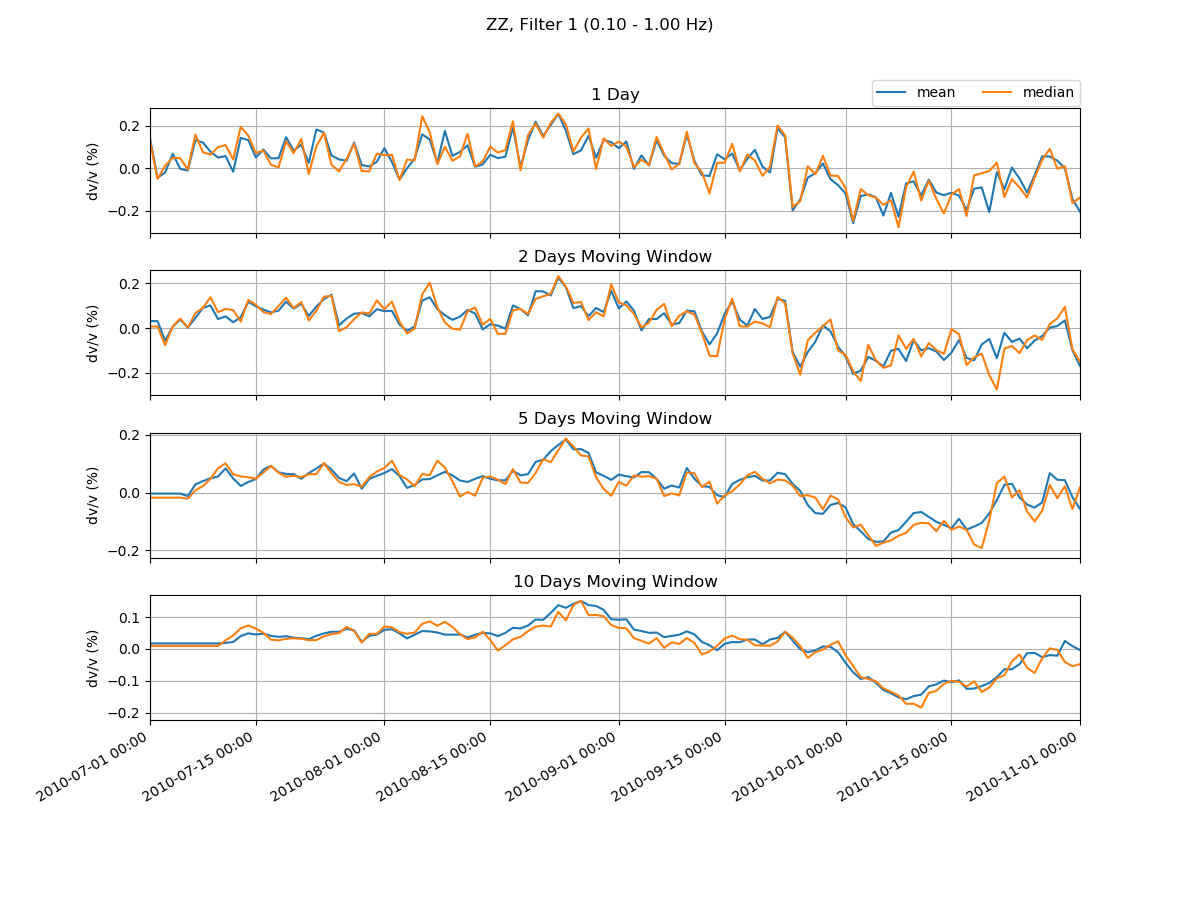
→ Plot dv/v

This plot shows the final output of MSNoise.

msnoise cc dvv plot dvv --help

Usage:  [OPTIONS]

  Plots the dv/v (parses the dt/t results) Individual pairs can be plotted
  extra using the -p flag one or more times. Example: msnoise plot dvv -p
  ID_KWUI_ID_POSI Example: msnoise plot dvv -p ID_KWUI_ID_POSI -p
  ID_KWUI_ID_TRWI Remember to order stations alphabetically !

Options:
  -f, --filterid INTEGER   Filter ID
  -c, --comp TEXT          Components (ZZ, ZE, NZ, 1E,...). Defaults to ZZ
  -m, --mov_stack INTEGER  Plot specific mov stacks
  -p, --pair TEXT          Plot a specific pair
  -A, --all                Show the ALL line?
  -M, --dttname TEXT       Plot M or M0?
  -s, --show BOOLEAN       Show interactively?
  -o, --outfile TEXT       Output filename (?=auto). Defaults to PNG format,
                           but can be anything matplotlib outputs, e.g. ?.pdf
                           will save to PDF with an automatic file naming.
  --help                   Show this message and exit.

Example:

msnoise cc dvv plot dvv will plot all defaults:

../_images/dvv.png