→ Plot MWCS results

This plot shows the result of the MWCS calculations in two superposed images. 
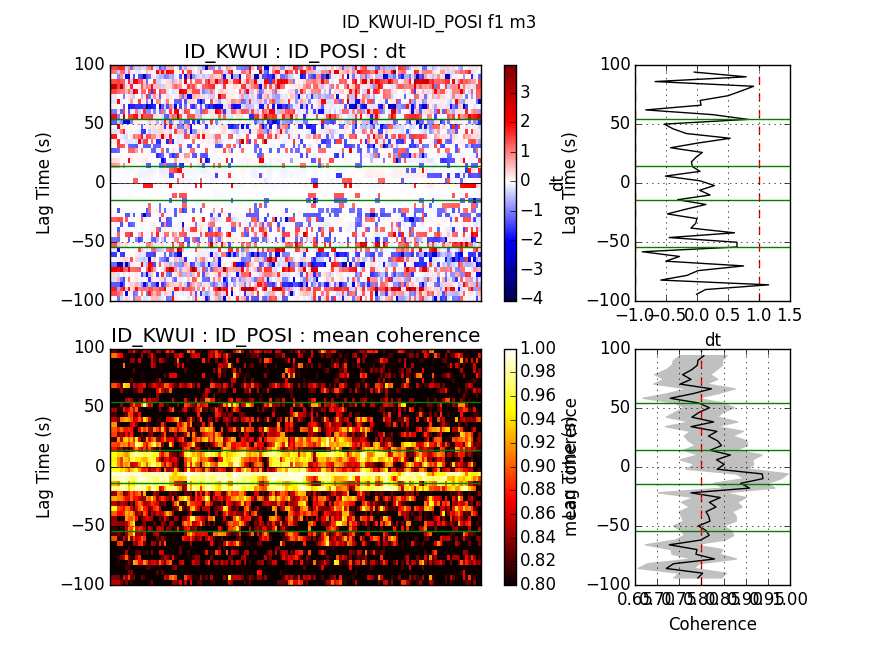
One is the dt calculated vs time lag and the other one is the coherence. The image is constructed by horizontally stacking the MWCS of different days. The two right panels show the mean and standard deviation per time lag of the whole image. The selected time lags for the dt/t calculation are presented with green horizontal lines, and the minimum coherence or the maximum dt are in red.

The filterid, comp and mov_stack allow filtering the data used.

msnoise cc dvv plot mwcs --help

Usage:  [OPTIONS] STA1 STA2

  Plots the mwcs results between sta1 and sta2 (parses the CCFs) STA1 and STA2
  must be provided with this format: NET.STA !

Options:
  -f, --filterid INTEGER   Filter ID
  -c, --comp TEXT          Components (ZZ, ZE, NZ, 1E,...). Defaults to ZZ
  -m, --mov_stack INTEGER  Mov Stack to read from disk. Defaults to 1.
  -s, --show BOOLEAN       Show interactively?
  -o, --outfile TEXT       Output filename (?=auto). Defaults to PNG format,
                           but can be anything matplotlib outputs, e.g. ?.pdf
                           will save to PDF with an automatic file naming.
  --help                   Show this message and exit.

Example:

msnoise cc dvv plot mwcs ID.KWUI ID.POSI -m 3 will plot all defaults with the mov_stack = 3:

../_images/mwcs.png