Note
Click here to download the full example code
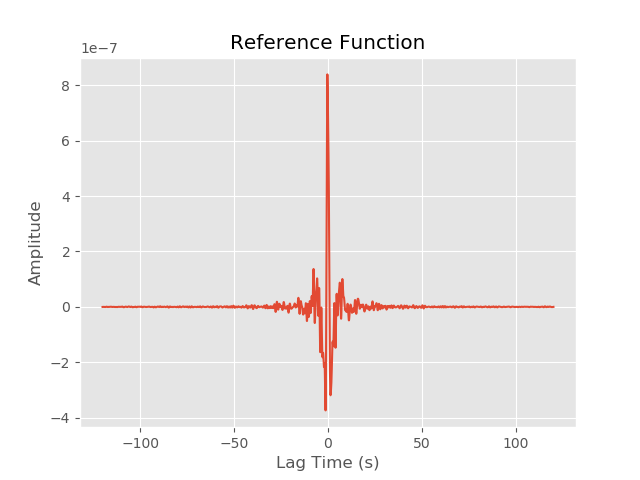
Plot a Reference CCF
# The following two lines are only needed for building this documentation
# Delete them and run the code in your project folder.

import os
if "SPHINX_DOC_BUILD" in os.environ:
    os.chdir(r"C:\tmp\msnoise_doc_project")

import matplotlib
matplotlib.use("agg")

import matplotlib.pyplot as plt
import numpy as np
import pandas as pd
from pandas.plotting import register_matplotlib_converters
register_matplotlib_converters()


plt.style.use("ggplot")

from msnoise.api import connect, get_results, build_movstack_datelist, get_params, get_t_axis

# connect to the database
db = connect()

# Obtain a list of dates between ``start_date`` and ``enddate``
start, end, datelist = build_movstack_datelist(db)

# Get the list of parameters from the DB:
params = get_params(db)

# Get the time axis for plotting the CCF:
taxis = get_t_axis(db)

# Get the results for two station, filter id=1, ZZ component, mov_stack=1 and stack the results:
n, ccf = get_results(db, "YA_UV05", "YA_UV12", 1, "ZZ", datelist, 1, format="stack", params=params)

plt.figure()
plt.plot(taxis, ccf)
plt.title("Reference Function")
plt.xlabel("Lag Time (s)")
plt.ylabel("Amplitude")


#EOF
Total running time of the script: ( 0 minutes 0.926 seconds)