Note
Click here to download the full example code
Plot an interferogram
import os
if "SPHINX_DOC_BUILD" in os.environ:
os.chdir(r"C:\tmp\msnoise_doc_project")
import matplotlib
matplotlib.use("agg")
import matplotlib.pyplot as plt
import numpy as np
import pandas as pd
from pandas.plotting import register_matplotlib_converters
register_matplotlib_converters()
plt.style.use("ggplot")
from msnoise.api import connect, get_results, build_movstack_datelist, get_params, get_t_axis
# connect to the database
db = connect()
# Obtain a list of dates between ``start_date`` and ``enddate``
start, end, datelist = build_movstack_datelist(db)
# Get the list of parameters from the DB:
params = get_params(db)
# Get the time axis for plotting the CCF:
taxis = get_t_axis(db)
# Get the results for two station, filter id=1, ZZ component, mov_stack=1 and the results as a 2D array:
n, ccfs = get_results(db, "YA_UV05", "YA_UV12", 1, "ZZ", datelist, 1, format="matrix", params=params)
# Convert to a pandas DataFrame object for convenience, and drop empty rows:
df = pd.DataFrame(ccfs, index=pd.DatetimeIndex(datelist), columns=taxis)
df = df.dropna()
# Define the 99% percentile of the data, for visualisation purposes:
clim = df.mean(axis="index").quantile(0.99)
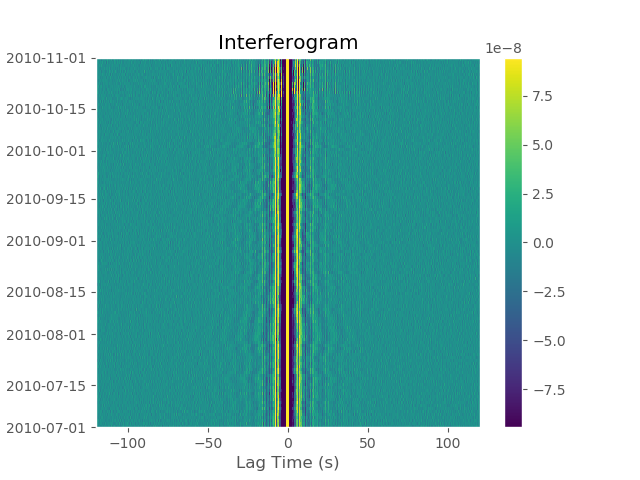
fig, ax = plt.subplots()
plt.pcolormesh(df.columns, df.index.to_pydatetime(), df.values,
vmin=-clim, vmax=clim, rasterized=True)
plt.colorbar()
plt.title("Interferogram")
plt.xlabel("Lag Time (s)")
plt.ylim(df.index[0],df.index[-1])
plt.xlim(df.columns[0], df.columns[-1])
plt.subplots_adjust(left=0.15)
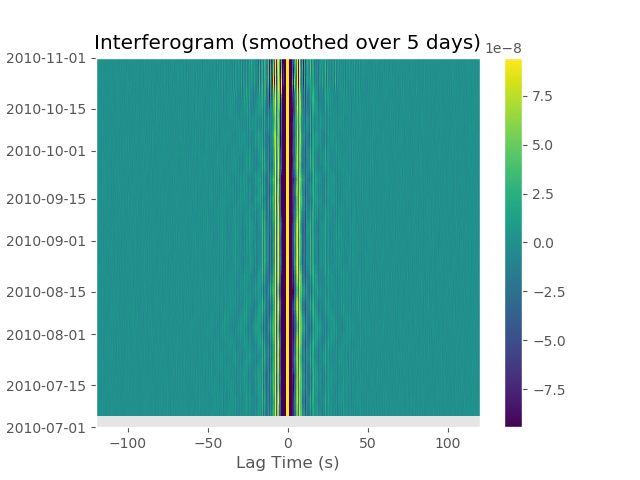
Running a simple moving window average can be done with pandas’s functions:
smooth = df.rolling(5).mean()

fig, ax = plt.subplots()
plt.pcolormesh(smooth.columns, smooth.index.to_pydatetime(), smooth.values,
               vmin=-clim, vmax=clim, rasterized=True)
plt.colorbar()
plt.title("Interferogram (smoothed over 5 days)")
plt.xlabel("Lag Time (s)")
plt.ylim(smooth.index[0],smooth.index[-1])
plt.xlim(smooth.columns[0], smooth.columns[-1])
plt.subplots_adjust(left=0.15)


plt.show()
#EOF
Out:
D:\PythonForSource\MSNoise_Stack\MSNoise\examples\plot_interferogram.py:75: UserWarning: Matplotlib is currently using agg, which is a non-GUI backend, so cannot show the figure.
  plt.show()
Total running time of the script: ( 0 minutes 1.870 seconds)